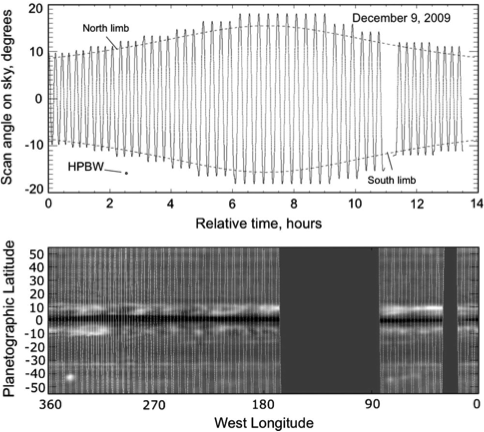
This map shows the pattern of Cassini spacecrafts well-controlled up-and-down nodding movements. These made it possible for the microwave radiometer to gather global measurements of Saturn's atmosphere, reflected in the example data
| Nominal radiometer characteristics. |
||||
|---|---|---|---|---|
| Frequency | 13.78 GHz |
| Wavelength | 2.18 cm |
| Polarization | 1 linear |
| Radiometer bandpass | 135 MHz |
| Measurement noise | 0.026 K/pHz |
| Beam full width at half-power (beam 3) | 0.36" Circular |
Derived data
The RADAR radiometer was used to observe Saturn during five equatorial periapsis passes occurring between 2005 and 2011 for the purpose of mapping its 2.2-cm thermal emission. This data set is comprised of well-calibrated, high-resolution global maps of Saturn’s thermal emission at 2.2-cm wavelength obtained by the Cassini RADAR radiometer through the Prime and Equinox Cassini missions, a period covering approximately six years. The absolute brightness temperature calibration of 2% achieved is more than twice better than for all previous microwave observations reported for Saturn, and the spatial resolution and sensitivity achieved each represent nearly an order of magnitude improvement. The brightness temperature of Saturn in the microwave region depends on the distribution of ammonia. The radiative transfer modeling used in processing this data shows that ammonia is the only significant source of absorption in Saturn’s atmosphere at 2.2-cm wavelength. At this wavelength the thermal emission comes from just below and within the ammonia cloud-forming region and yields information about atmospheric circulations and ammonia cloud-forming processes.
These maps are presented as residuals compared to a fully saturated model atmosphere in hydrostatic equilibrium. Also included are time-ordered data detailing the modeling results, referencing the midpoint of each radiometric integration period. Observational parameters are given below.
Observational Approach
The RADAR radiometer was used to observe Saturn during five equatorial periapsis passes occurring between 2005 and 2011 for the purpose of mapping its 2.2-cm thermal emission. Observational parameters are given below.
 Derived Data
 are located at the
cassini_saturn_radar_maps bundle
The following files contain:
Tabular data
Saturn_XXX.csv & Saturn_XXX_tod _xml (PDS4 version)
Saturn_XXX.txt data with attached header
Planetocentric Maps
Saturn_XXX_pc.ff & Saturn_XXX_pc.xml (PDS4 version}
Saturn_XXX_pc.fits
Planetographic Maps
Saturn_XXX_pg.ff & Saturn_XXX_pg.xml (PDS4 version)
Saturn_XXX_pg.fits
Note: The ff files are text files consisting of 721 by 321 matrices of brightness temperature residuals corresponding to 0 to 360 degree longitude by -80 to 80 deg latitude map at 0.5 deg resolution. Sequence of acquisition are given near the end of the map XML labels.
Raw Data are archived by the PDS Imaging node at JPL and USGS-Flagstaff.
References
Elachi, C., et al, 2004. RADAR: The Cassini Titan radar mapper. Space Science Reviews 115, 71-110. DOI:
10.1007/s11214-004-1438-9.
Janssen, M.A., et al., 2009, Titan’s surface at 2.2-cm wavelength imaged by the Cassini RADAR radiometer: calibration and first results. Icarus, 200, 222-239, DOI:
10.1016/j.icarus.2008.10.017
Janssen, M.A., et al., 2013, Saturn’s Thermal Emission at 2.2-cm Wavelength as Imaged by the Cassini RADAR Radiometer, Icarus, Volume 226, Issue 1, p. 522-535, DOI:
10.1016/j.icarus.2013.06.008.
Moeckel, C, Janssen, M, De Pater, I, (2019) A re-analysis of the Jovian radio emission as seen by Cassini-RADAR and evidence for time variability, Icarus, 321, 994-1012, DOI:
10.1016/j.icarus.2018.12.013.
Citation
Janssen (2021) Saturn's Thermal Emission at 2.2-cm from Cassini RADAR Radiometry, NASA Planetary Data System, DOI XXXXXXXXX.
 PDS: The Planetary Atmospheres Node
 This map shows the pattern of Cassini spacecrafts well-controlled up-and-down nodding movements. These made it possible for the microwave radiometer to gather global measurements of Saturn's atmosphere, reflected in the example data
