Planetary Atmosphere's Datasets


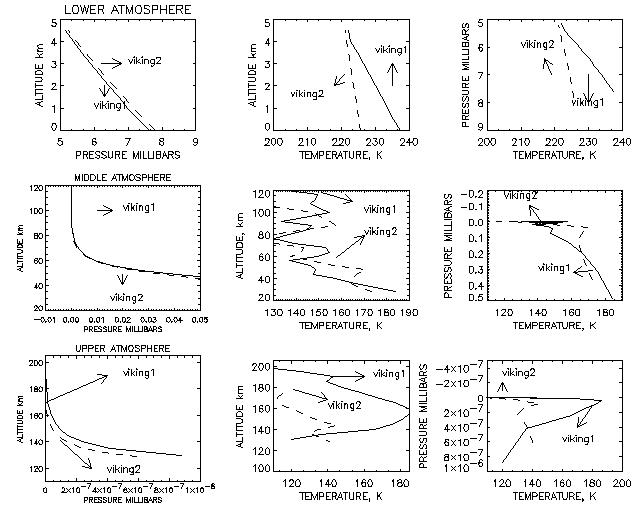
Mars Temperature and Pressure
Source: Seiff, A., Kirk, D.B., 1977, Structure of the Atmosphere of Mars in Summer at Mid-Latitudes, Journal of Geophysical Research, 82, 4364-4378.

Download graph as jpeg 77 kb
Download graph as post script file 1 mb
EXAMPLE STRUCTURE OF TEXT FILE
| Altitude, | Pressure, | Temperature, | Density, | Pressure, | Temperature, | Density, |
| (km) | (mbar) | (K) | (kg/m3) | (mbar) | (K) | (kg/m3) | 120 | 4.14(-6) | 136.3 | 1.60(-8) | 1.99(-6) | 116.0 | 8.86(-9) |
| 116 | 6.91(-6) | 149.2 | 2.42(-8) | 3.76(-6) | 115.5 | 1.69(-8) |
| 112 | 1.12(-5) | 148.6 | 3.95(-8) | 6.98(-6) | 118.2 | 3.08(-8) |
| 108 | 1.84(-5) | 146.4 | 6.59(-8) | 1.30(-5) | 121.1 | 5.62(-8) |
| 104 | 3.03(-5) | 149.4 | 1.06(-7) | 2.35(-5) | 131.8 | 9.36(-8) |
| 100 | 4.94(-5) | 154.8 | 1.67(-7) | 4.01(-5) | 147.9 | 1.42(-7) |
Download file as text 4 kb