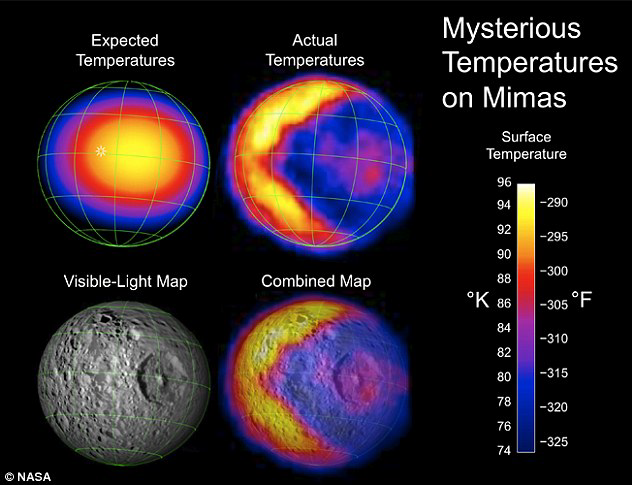
This figure illustrates the unexpected and bizarre pattern of daytime temperatures found on Saturn's small inner moon Mimas that was revealed by the Composite Infrared Spectrometer.
See
Volume 1-Mission Overview, Science Objectives and Results for full science report. The technical report is in other volumes archived at the Jet Propulsion Lab.
Mission Science Highlights and Science Objectives Assessment provides a brief overview of the mission
About CIRS
Cassini's Composite Infrared Spectrometer (CIRS) was used for the investigation of the Saturn system in the mid to far infrared range. CIRS used three separate
detectors which spanned wavelengths between 1 mm and 7 µm. The instrument inherited its design from the Infrared Interferometer Spectrometer IRIS which was onboard each of the Voyager spacecraft. The CIRS instrument was assembled at the NASA Goddard Spaceflight Center (GSFC) and contains components that were
built at Oxford University and CEA Saclay, as well as NASA GSC.
Scientific objectives for CIRS include the following:
- Map the thermal structure and composition of the atmospheres of Saturn and Titan
- Search for new molecular species in the atmosphere of Saturn
- Investigate the thermal structure of Saturn's main rings
- Determine the composition and size distribution of the particles that comprise Saturn's main rings
- Map the temperature and composition of Titan and Saturn's icy satellites
- Determine the subsurface regolith structure of Saturn's icy satellites
- Search for any seasonal variability among the physical properties in the components of the Saturn system
CIRS detectors:
- Polarizing interferometer: Far-IR on FP1 (Focal Plane Array 1)
- Michelson interferometer: Mid-IR on FP3 and FP4
- See the table below for the spectral ranges detected by each Focal Plane Array
CIRS Instrument Characteristics*
| General Specifications |
|
|
|
| Telescope Diameter (cm) |
50.8 |
| Instrument Temperature (K) |
170 |
| Interferometers |
Far-IR |
Mid-IR |
|
| Type |
Polarizing |
Michelson |
| Spectral Range (cm-1) |
10–600 |
600–1400 |
| Spectral Range (µm) |
17–1000 |
7–17 |
| Spectral Resolution (cm-1) |
0.5–15.5 |
0.5–15.5 |
| Integration time (s) |
2–50 |
2–50 |
|
| Focal Plane Arrays |
FP1 |
FP3 |
FP4 |
| Spectral Range (cm-1) |
10–600 |
600–1100 |
1100–1400 |
| Spectral Range (µm) |
17–1000 |
7–9 |
9–17 |
| Detectors |
Thermopile |
PC HgCdTe |
PV HgCdTe |
| Pixels |
2a |
1 x 10 |
1 x 10 |
| Pixel FOV (mrad) |
3.9 |
0.273 |
0.273 |
| Peak Detectivityb (cm Hz1/2 W-1) |
4 x 10⁹ |
2 x 10¹⁰ |
5 x 10¹¹ |
a Single FOV, two polarizations.
b Detectivity, a measurement of detector performance sometimes referred to as D*, is equal to the square root of the product of the detector area and frequency bandwidth divided by the noise-equivalent power
* Values taken from Table I of Flasar et al. (2004) in Space Science Review
A 3050 mm focal length Cassegrain telescope was incorporated into CIRS' optics.
The telescope directed incoming radiation into two separate interferometers, one polarizing and the other a Michelson.
The polarizing interferometer detected photons with wavenumbers from 10 - 600 cm-1 (16.7 µm - 1 mm) at the
focal plane array called FP1. This array was comprised of two thermopile detectors with a 3.9 mrad field of view (FOV).
The conventional Michelson interferometer detected mid-infrared photons towards using two focal plane arrays: FP3 and FP4.
FP3 and FP4 consisted of ten HgCdTe detectors with a 0.273 mrad FOV.
FP4 measured radiation from 600 - 1100 cm-1 (9 - 16.7 µm), while FP4 covered 1100 - 1400 cm-1 (7 - 9 µm)
The FP3 and FP4 arrays were able to be commanded to one of three distinct spatial modes.
Additionally, CIRS was able to record at four discrete spectral resolutions.
The engineering details of the CIRS instrument and the science objectives it was built to address are described in further detail in the
Space Science Reviews paper by
Flasar et al. (2004).
Additional publications which describe the instrument are listed below:
- Cassini infrared Fourier spectroscopic investigation.
Proc. SPIE 2803, 162-177 (1996) by
Kunde, V. G., et al.
- Exploring the Saturn system in the thermal infrared: the composite infrared spectrometer.
Space Sci. Rev. 115, 169-297 (2004) by
Flasar, F. M., et al.
- The Composite Infrared Spectrometer (CIRS) on Cassini.
Applied Optics, 56, 5274 by
Jennings, D. E., et al. (2017).
CIRS Data
Data Search Tools
- The Event Calendar is an interactive event-finding tool that can be used to search for data associated with particular events.
- The Master Schedule is a time-ordered listing of observations by all instruments. This may help find data based on particular events.
Browse Raw Data Products
Archive Links
- Links to raw data products along with reference tables to aid in finding archived data files related to observations of Saturn, moons, and other targets.
- The folders within the link are formatted as 'cocirs_yymm' where 'yymm' indicate the year and month.
- Users should know when the data of interest was taken because data products are stored in the directories chronologically by the date of acquisition.
Jupiter Archive Links
- Links to raw data products along with reference tables to aid in finding archived data files related to observations of the Jovian system.
- The folders within the link are formatted as 'cocirs_yymm' where 'yymm' indicate the year and month.
- Users should know when the data of interest was taken because data products are stored in the directories chronologically by the date of acquisition.
Derived Data Products
CUBE Directory
- The CIRS team has produced image cubes from observations of Saturn, Titan, and Saturn's icy satellites and its other moons.
Selecting Data Products
The CIRS team has provided a set of target notebooks that provide details on the many CIRS observations and observation campaigns pursued during the course of the Cassini mission.
The Event Calendar is an interactive event-finding tool that can be used to search for data associated with particular events.
Atlas of coverage plots
Analyzing CIRS Data
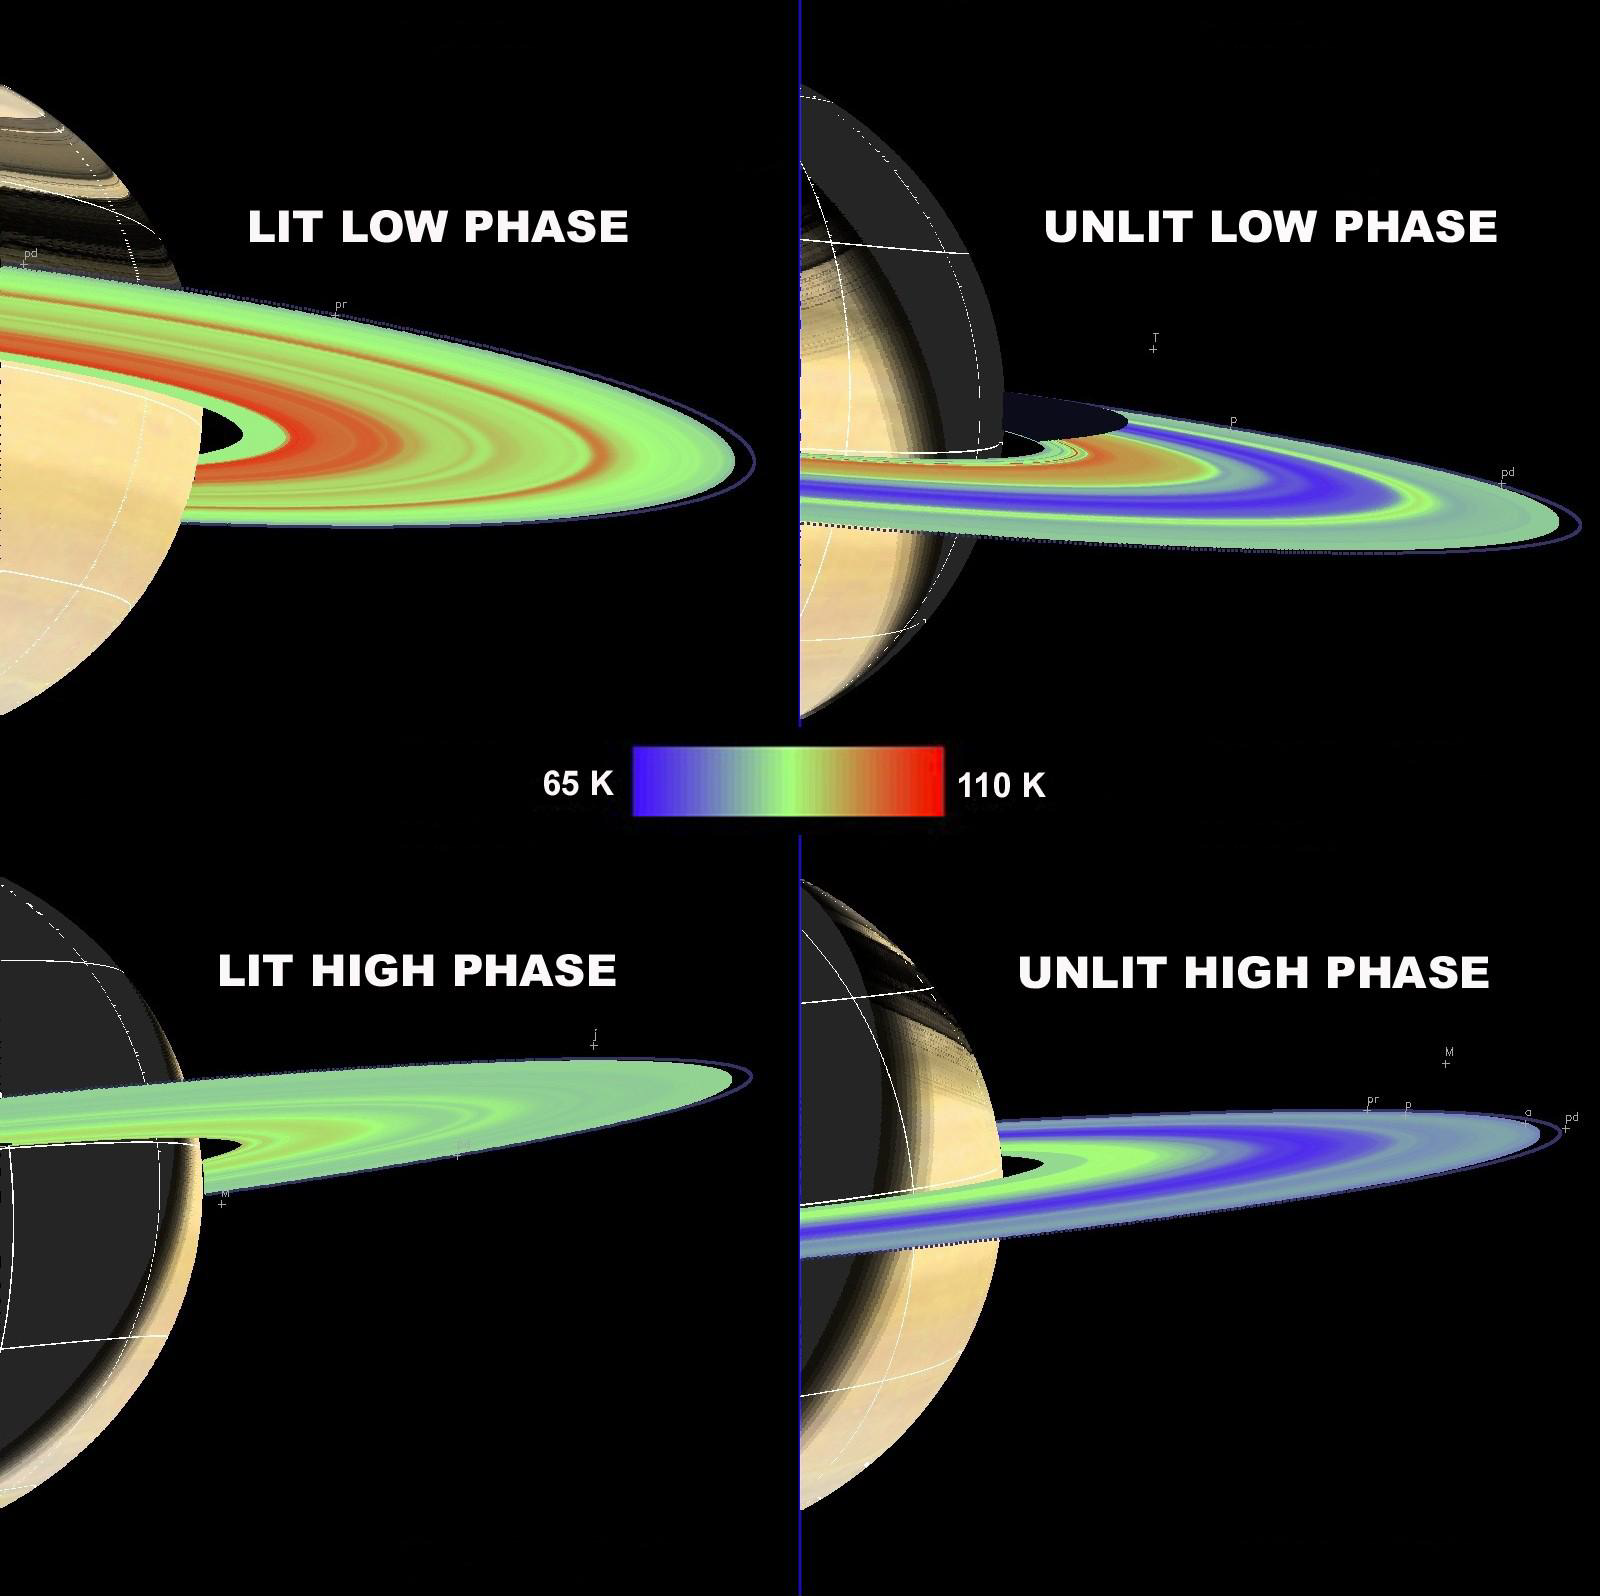 CIRS obtained temperature maps of Saturn's main rings (A, B and C) that showed ring temperatures decreasing with increasing solar phase angle on both the lit and unlit sides of the rings.
The CIRS team has archived several ancillary products that will help users understand and manipulate the archived data.
Other documents that might aid in the interpretation of CIRS data include: