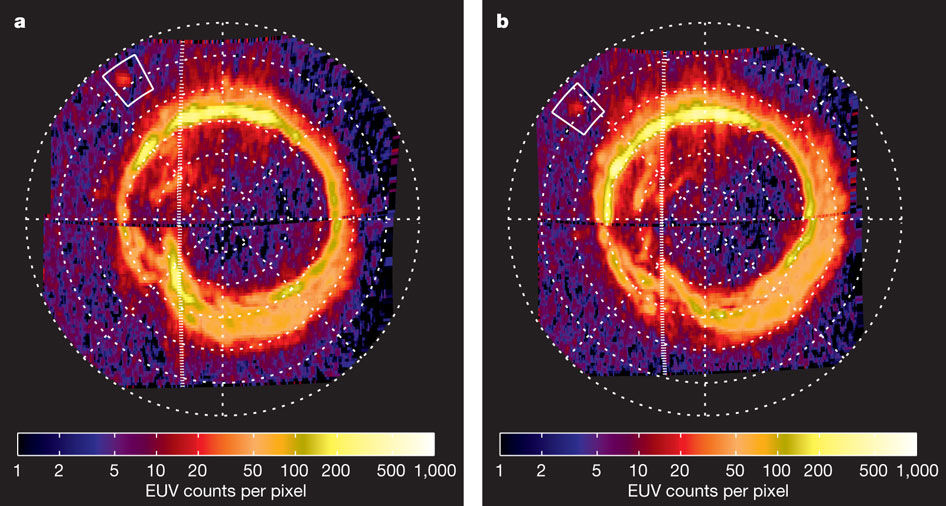
 These images from Pryor et al. of Saturn's northern aurora were created using data from the Ultraviolet Imaging Spectrograph.
See
Volume 1-Mission Overview, Science Objectives and Results for full science report. The technical report is in other volumes archived at the Jet Propulsion Lab.
Mission Science Highlights and Science Objectives Assessment provides a brief overview of the mission
About UVIS
The Cassini Ultraviolet Imaging Spectrograph (UVIS) was a composite instrument consisting of two moderate-resolution
spectrographs, a High-Speed Photometer (HSP) and a Hydrogen Deuterium Absorption Cell (HDAC) to measure hydrogen/deuterium
ratios. The spectrographs and HSP were built at the Laboratory for Atmospheric and Space Physics (LASP) at the University of
Colorado Boulder. The HDAC was supplied by the former Max-Planck-Institut für Aeronomie
in Katlenburg-Lindau, Germany (now Max Planck Institute for Solar System Research in Göttingen, Germany).
Scientific objectives for UVIS include the following:
- Map the vertical and horizontal compositions of the Saturn and Titan upper atmospheres
- Determine the atmospheric chemistry occurring in the Saturn and Titan atmospheres
- Map the distributions and properties of aerosols in the Saturn and Titan atmospheres
- Infer the nature and characteristics of circulation in the Saturn and Titan atmospheres
- Create a map of the distributions of neutrals and ions in Saturn's magnetosphere
- Study the radial structure of Saturn's rings by means of stellar occultations
- Study the surface ices and any tenuous atmospheres associated with the icy satellites
UVIS Channels and Detectors:
- Extreme Ultraviolet (EUV) and Far Ultraviolet (FUV) Channels: Spectrographic channels for the ultraviolet range
- High-Speed Photometer (HSP) : used to improve the signal-to-noise for stellar occultations
- Hydrogen Deuterium Absorption Cell (HDAC) : measured relative abundance of deuterium and hydrogen from Lyman-alpha emission
UVIS Instrument Characteristics*
| |
FUV |
EUV |
HSP |
HDAC |
| Telescope |
|
|
|
|
| Telescope Focal Length Size (mm) |
100 |
100 |
200 |
150 |
| Entrance Pupil Size (mm) |
20 x 20 |
20 x 20 |
135 x 30 |
25 (diameter) |
| Reflecting Surface |
Al + MgF2 |
Boron Carbide (B4C) |
Al + MgF2 |
MgF2 |
| Toroidal Gratings |
|
|
|
|
| Grating Size (mm) |
60 X 60 |
60 X 60 |
- |
|
| Grating Radii (mm) |
200, 296.1 |
300, 296.8 |
- |
|
| Grating Surface |
Al + MgF2 |
Boron Carbide (B4C) |
- |
|
| Grooves/mm |
1068 |
1371 |
- |
|
| Three-Position Slits |
|
|
|
|
| Slit Widths (µm) |
75, 150, 800 |
100, 200, 800 |
6 x 6 |
|
| Δλ(Å) |
2.75, 4.8, 24.9 |
2.75, 4.8, 19.4 |
- |
|
| Field of View (mrad) |
(0.75, 1.5, 8) x 60 |
(1, 2, 8) x 59 |
- |
58 (diameter) |
| Detectors |
|
|
|
|
| Spectral Range (Å) |
1115-1912 |
563-1182 |
~1150-~1900 |
1150-2400 |
| Photocathode |
CsI |
KBr |
CsI |
KBr |
| Maximum QE (%) |
8 |
25 |
10 |
|
| Detector Window |
MgF2 |
none |
MgF2 |
MgF2 |
| Detector Size (mm) |
25.6 x 6.4 |
25.6 x 6.4 |
8 (diameter) |
13 (diameter) |
| Pixel Format (l x θ) |
1024 x 64 |
1024 x 64 |
- |
|
| Pixel Size (µrad) |
25 x 100 |
25 x 100 |
- |
|
| Pulse Resolution (µsec) |
10 |
10 |
0.05 |
|
* values taken form Table II in Esposito et al. (2004) Space Science Reviews
UVIS consisted of two spectrographic channels, the extreme ultraviolet channel (EUV) and the far ultraviolet channel (FUV).
The EUV provided images and spectra covering the range from 56 to 118 nm while the FUV covered the range from ~110 to ~190 nm (
Esposito et al.),
without discrimination between wavelengths. The Individual Coded Anode Ray Converter (CODACON) detector recorded incident
photons in each of the two ultraviolet wavelength ranges. The CODACONs each had 1024x64 pixels which allowed for simultaneous spectral and one-dimensional
special coverage. A third optical path led to UVIS's HSP, which employed a solar-blind Csl photocathode for high signal-to-noise
ratio stellar occultation. The HSP was distinguished by its short, 2 millisecond integration time. The HDAC portion of the UVIS instrument measured the
relative abundance of deuterium and hydrogen from their Lyman-alpha emission.
The
User's Guide includes information on the instrument specifications, data calibration and analysis with Cube Generator. It also includes some analysis examples using Saturn's aurora, ring and icy satellite occultations, ring spectroscopy and reflectance spectroscopy. The engineering details of the UVIS instrument and the science objectives it was built to address are described in further detail in the Space Science Reviews paper by
Esposito et al. (2004).
Housekeeping data — These are plots of the main UVIS engineering data. In flight the UVIS engineering measurements were sampled every 64 seconds. Each folder contains 3 months of data with a 1 month overlap with preceding and following folders.
UVIS Data
Data Search Tools
- The Event Calendar is an interactive event-finding tool that can be used to search for data associated with particular events.
- The OPUS search engine allows for an interactive search of the UVIS data in the PDS archive based on a wide variety of search parameters, including observation geometry and target.
- The Master Schedule is a time-ordered listing of observations by all instruments. This may help find data based on particular events, however the OPUS tool linked above will be much simpler to use in most circumstances.
- Cumulative Geometry Tables are available for the entire UVIS data set.
Browse Raw Data Products
Archive Links
- Links to raw data products along with reference tables to aid in finding archived data files related to observations of Saturn, moons, and other targets.
- Users should know when the data of interest was taken as the data products which are stored in the directories are chronologically ordered by the date of acquisition.
Derived Data Products
UVIS Rings Occultation Profiles
- The Occultation Profiles are a set of peer-reviewed data sets located at the PDS Ring-Moon Systems Node
- The data includes radial profiles at 1 and 10 km resolution derived from more than 50 UVIS stellar occultations.
Selecting Data Products
The UVIS team has provided a number of archive products that provide detail on the many UVIS observations taken during the course of the Cassini mission.
These archive products are listed below.
Analyzing UVIS Data
Several software routines that were used to analyze UVIS observations over the course of the Cassini mission have been archived by the UVIS team
and can be located at dedicated
GitHub Organization Page.
Once data products have been selected and retrieved, users will need appropriate software to read, manipulate and display that data.
Software packages that will enable users to make use of UVIS data are listed below. (Note: most UVIS-supplied routines are written in the IDL software language.)
- Geometer Software and User's Guide - select appropriate SPICE kernels and generate geometry information associated with UVIS observations
- Ring Occultation Data Analysis Tool (ROCC DAT) - generate ring optical depth profiles from UVIS HSP data taken during ring stellar occultations; some users have extended the use of this software to occultation observations of objects other than Saturn's rings
- Cube Generator Software and User's Guide - produces image cubes from UVIS data and implements optional calibrations; interfaces with geometer to produce geometric backplanes
- UVIS PDS Label Reader - read a subset of the fields available in a Cassini UVIS PDS label file (IDL)
- UVIS PDS Data Reader - read binary data from a Cassini UVIS PDS data file and also return a subset of the fields in the label file (IDL)
- pyuvis - a rudimentary Python module for reading PDS UVIS data