See
Volume 1-Mission Overview, Science Objectives and Results for full science report. The technical report is in other volumes archived at the Jet Propulsion Lab.
Mission Science Highlights and Science Objectives Assessment provides a brief overview of the mission
About RPWS
The Radio and Plasma Wave Science (RPWS) instrument on the Cassini spacecraft was designed to study radio emissions, plasma waves, thermal plasma, lightning, and dust throughout the Saturnian system. It is composed of seven separate sensors: an electric field detector composed of three ten-meter long orthogonal antennas, a Langmuir probe for measuring electron density and temperature and a wave magnetic field antenna assembly which consists of three orthogonal search coils. The instrument, whose components were dispersed across the spacecraft, was built by collaborators at the University of Iowa, the Observatoire de Paris Meudon, the Université Versailles Saint Quentin and the Swedish Institute of Space Physics.
Scientific objectives for the RPWS include the following:
- Study the source of Saturn Kilometric Radiation (SKR)
- Investigate the rotational modulation of SKR
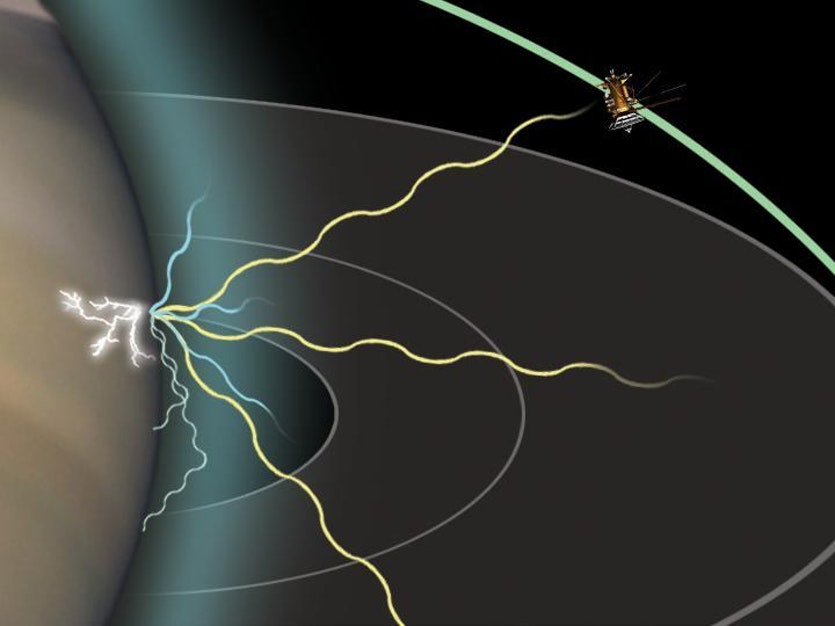
- Detect and study the radio signals from lightning in Saturn's and Titan's atmospheres
- Determine the dust and meteoroid distributions throughout the Saturnian system and interplanetary space
- Investigate the interactions of the icy satellites and the rings with the magnetosphere
- Study the ionization of Titan's upper atmosphere and ionosphere and the interactions of the atmosphere and exosphere with the surrounding plasma
- Study the interaction of Titan and its induced magnetosphere with the solar wind and magnetospheric plasma
- Characterize the radio and plasma waves present in the Saturnian system, and investigate their role in wave-particle interactions and dynamics
RPWS Detectors:
- Electric field detector: three orthogonal antennas
- Wave magnetic field antenna: three orthogonal search coils
- Langmuir probe (LP): used to measure electron density and temperature
RPWS Instrument Characteristics*
| Receivers |
Measurement |
Frequency
Range |
Frequency
Steps |
Frequency
Resolution |
Effective
Bandwidth |
Integration
Times |
Temporal
Resolution |
| HFR |
|E1|2, |E2|2, Re(E1·E2*), Im(E1·E2*)a |
| Band = A |
|
3.5–16 kHz |
8, 16, 32 |
20%, 10%, 5% |
|
0.125, 0.25, 0.5, 1 s |
0.1–10 s/spectrum |
| B |
|
16–71 kHz |
8, 16, 32 |
20%, 10%, 5% |
|
0.125, 0.25, 0.5, 1 s |
0.1–10 s/spectrum |
| C |
|
71–319 kHz |
8, 16, 32 |
20%, 10%, 5% |
|
0.125, 0.25, 0.5, 1 s |
0.1–10 s/spectrum |
| HF1 |
|
0.125–4.125 MHz |
n x 25 kHzb |
3.125, 6.25, 12.5, 25 kHz |
|
20, 40, 80, 160 ms |
0.1–10 s/spectrum |
| HF2 |
|
0.125–16.125 MHz |
n x 50 kHzc |
3.125, 6.25, 12.5, 25 kHz |
|
10, 20, 40, 80 ms |
0.1–10 s/spectrum |
| MFR
| One of: Ex, Eu, Ev, Ew, Bx, Bz
MFDR -- sometimes used in place of MFR Band 2 |
| Band = 1 |
|
24–180 Hz |
16 |
Δf/f = 13% |
5.6 Hz |
|
16 s/spectrum |
| 2 |
|
180–1500 Hz |
32 |
Δf/f = 7% |
19.4 Hz |
|
16 s/spectrum |
| 3 |
|
1500–12000 Hz |
32 |
Δf/f = 7% |
139 Hz |
|
8 s/spectrum |
| WFR
| Five of: Ex, Eu, Ev, Ew, Bx, By, Bz, LP |
~1–26 Hz; 3–2500 Hz |
|
0.2 Hz, typical; 3.5 Hz, typical |
|
|
1 data set/5 min, typical; 1 data set/16 s, max |
|
| LFR
| Two of: Ex, Eu, Ev, Ew, Bx, By, Bz, LP |
~1–26 Hz |
|
Δf/f = 12% |
|
|
1 E + 1 B spectrum/16 s, typical |
|
| WBR
| One of: Ex, Eu, Ev, Ew, Bx, LP |
60–10500 Hz; 0.8–75 kHz |
|
13.6 Hz, typical; 109 Hz, typical |
|
|
125 ms/spectrum, typical |
HFR = high frequency receiver; MFR = medium frequency receiver; WFR = five-channel waveform receiver; LFR = low frequency receiver; WBR = wideband receiver; LP = Langmuir probe
aE1 = Eu, Ev, or Ex; E2 = Ew
b1, 2, 4 or 8 channels within 25-kHz band
c1, 2, 4 or 8 channels within 50-kHz band
* includes values taken from Tables II, IV, and VI in Gurnett et al. (2004) in Space Science Reviews
The RPWS instrument typically obtained electric field measurements from about 1 Hz to 16 MHz and magnetic field observations from about 1 Hz to 12 kHz. The Langmuir Probe was a 5-cm titanium sphere mounted on the end of a 0.8 m boom.
More information about the RPWS can be found at the instrument's
public webpage. Additional details about geometry, sequencing, instrument modes, and analysis tools can be found in the
Team Web Pages. The engineering details of the RPWS instrument and the science objectives it was built to address are described in further detail in the
Space Science Reviews paper by
Gurnett et al. (2004).
RPWS Data
Search-for and Filter Raw Data
- Preliminary Fields and Particles and Auroral Schedules (CSV) to help find data at the planned observation dates. This file spans 2004-135 to 2010-32
- The Event Calendar is an interactive event finding-tool that can be used to search for data associated with particular events.
- The Master Schedule is a time-ordered listing of observations by all instruments. This can be used to find data based on particular events.
Browse Data Products
The following are archived volumes from the PDS Planetary Plasma Interactions node.
- Calibrated summary key parameter data- reduced temporal and spatial resolution, spectral information in units of spectral density
- HFR, MFR, and LFR receivers used
- Intended to provide numerical summary data to be used in conjunction with other Cassini key parameter data sets to establish trends, select events
- From LFR, MFR, HFR, Sounder, and Langmuir Probe
- Edited full resolution data set of uncalibrated values for each wideband channel for each sensor at all times
- Data acquired by WBR (wideband receiver)
- Separated by mode (10kHz, 80kHz)
- In time domain, can look for solitary features like dust impacts or electrostatic solitary waves
- Can use a Fourier transform to convert into frequency domain, to see detailed time and spectral evolution of plasma waves or radio emission
- Uncalibrated values for each waveform channel for each sensor at all times
- Acquired from the waveform receiver
- Two different modes (2.5kHz, 26Hz)
- Usually includes time-series for >1 up to 5 sensors at a time, where samples are simultaneous for each sensor
- Calibrated data for each frequency channel for each sensor at all times
- From HFR, MFR, LFR
- Units of spectral density
- Calibrated probe current measurements acquired at rates up to 20Hz at a fixed voltage throughout mission lifetime
- Can be used to infer high temporal resolution density fluctuations between standard sweeps
- Can be related to electron density measurements
- Calibrated voltage-current characteristics acquired continuously from most mission phases
- Can be used to derive thermal plasma parameters (e.g. electron density, temperature)
- Includes all thermal plasma information derived from voltage sweeps acquired in inner magnetosphere during Titan, Enceladus, and other icy satellite encounters
- Electron density, spacecraft potential, electron temperature
- Electron densities derived using empirical relation between floating potential and electron densities from Cassini Plasma Spectrometer
- Includes spacecraft potential
Selecting Data Products
Note:The sequence Information is archived with the data (See the
information for Sequence 101 as an example).
The
Event Calendar is an interactive event finding-tool that can be used to search for data associated with particular events.
Analyzing RPWS Data
Once data products have been selected and retrieved, users will need to read, manipulate and display that data. Resources that will enable users to make use of RPWS data are listed below.
RPWS Calibration Documentation provides calibrations for RPWS and other important information for the proper interpretation of data obtained from the instrument.