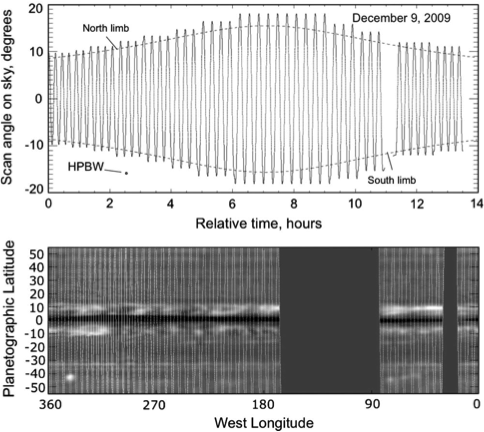
This map shows the pattern of Cassini spacecrafts well-controlled up-and-down nodding movements. These made it possible for the microwave radiometer to gather global measurements of Saturn's atmosphere, reflected in the example data.
Cassini radar instrument: radiometer mode
Radio Detection and Ranging (RADAR) can operate in three ways: imaging, altimetry and radiometry. For this data a 1-s duration burst cycle in which the active segment was eliminated and the antenna was set to the central (and smallest) radar beam, beam 3 was used. The radiometric segment was expanded to observe the target for the entire 1-s period except for a 25 ms integration on the reference load in each cycle. These choices provided the beamwidth and sensitivity given below.
| Nominal Radiometer Characteristics | | |
|---|
| Frequency | 13.78 GHz |
| Wavelength | 2.18 cm |
| Polarization | 1 linear |
| Radiometer bandpass | 135 MHz |
| Measurement noise | 0.026 K/pHz |
| Beam full width at half-power (beam 3) | 0.36" Circular |
Cassini Radiometer Data
Download the Derived Data Set
The RADAR radiometer was used to observe Saturn during five equatorial periapsis passes occurring between 2005 and 2011 for the purpose of mapping its 2.2-cm thermal emission. Observational parameters are given below.
Observation Parameters
| Date | Start Time
(UT) | Segments | Mapping
Duration (h) | S/C Orbit
Inclination* (0°) | Ring Plane Crossing
Longitude (°W Long) | |
|---|
| 23-Sept-05 | 11:15 | 3 | 22.78 | 0.32 | |
| 13-Oct-09 | 23:26 | 4 | 11.83 | 0.55 | 190.5 |
| 9-Dec-09 | 22:58 | 2 | 13.94 | 0.50 | 18.1 |
| 24-Jul-10 | 22:15 | 2 | 12.90 | 4.66 | 282.1 |
| 20-Mar-11 | 4:03 | 1 | 14.08 | 0.38 | |
*Relative to Saturn
Periapsis Parameters
| Date | Distance
(Rs) | Saturn Longitude
(°W Long) |
|---|
| 23-Sept-05 | 2.00 | 298.30 |
| 13-Oct-09 | 2.20 | 148.50 |
| 9-Dec-09 | 2.22 | 313.90 |
| 24-Jul-10 | 2.48 | 312.70 |
| 20-Mar-11 | 3.72 | 257.80 |
The Tabular Data (see
Explanation) consists of time ordered data derived from repetitive pole-to-pole scans through Saturn's nadir. The tables give point-by-point values (from 38 to 51 thousand entries) for longitude, latitude, beam parameters, distance to Saturn, viewing aspects of Saturn and the rings and brightness temperature relative to brightness temperatures for an
Assumed Model for Saturn's structure and ammonia distribution.
The
Final Residual Maps were produced by subtracting quiescent-band averages from each scan in the time-ordered data and interpolating on a regular grid in cylindrical planetographic coordinates.
Raw Data
The
Raw Data are archived by the PDS Imaging node at JPL and USGS-Flagstaff.
Additional Information
An AAREADME file, mission description, spacecraft description, instrument description, references and Principal Investigator information are available in the
Catalog Folder. Considerable information is available in the supporting papers:
M.A. Janssen et al,. Saturn's thermal emission at 2.2-cm wavelength as imaged
by the Cassini RADAR radiometer, Icarus 226 (2013) 522-535
A.L. Laraia et al.,Analysis of Saturn's thermal emission at 2.2-cm wavelength: Spatial
distribution of ammonia vapor, Icarus 226 (2013) 641-654