Overview
The Cassini spacecraft carried a suite of instruments that contributed to the study of Saturn's magnetosphere.
They were successful in carrying out a thorough investigation of Saturn's magnetospheric environment for more
than thirteen years in orbit at Saturn. The purpose of this page is to provide an understandable, consistent,
and accessible home for Cassini Magnetospheric Science Discipline data.
The
Magnetospheric Science Sections in Cassini Mission Final Report summarizes the status of magnetospheric science, in 2018, as a result of Cassini exploration of the Saturn system. It also includes open questions that will be explored by future scientists.
Mission Science Highlights and Science Objectives Assessment provides a brief overview of the mission
Charm Talks is a series of talks given by the team that provides insight into discovery and development of understanding
Mission Objectives
- Determine the configuration of the nearly axially symmetrical magnetic field and its relation
to the modulation of Saturn kilometric radiation (SKR).
- Determine current systems, composition, sources and sinks of magnetosphere charged
particles.
- Investigate wave-particle interactions and dynamics of the dayside magnetosphere and
magnetotail of Saturn, and their interactions with solar wind, satellites and the rings.
- Study the effect of Titan's interaction with solar wind and magnetospheric plasma.
- Investigate interactions of Titan's atmosphere and exosphere with the surrounding plasma.
The Cassini mission addressed each of these initial science objectives. As is typical in scientific investigations, the process of answering questions typically creates new unanticipated questions. A summary of the key Magnetospheric Science objectives updated over the course of the mission can be found in
Volume 1 of the Cassini Mission Final Report (in preparation).
The following PDFs describe the magnetospheric science performed during various phases of the mission, along with some associated journal references:
Fields and Particles Instruments
need to format this a bit
Six science instruments are typically identified with the Magnetospheric Science discipline. Each has their own individual PDS Help page with useful information including instrument descriptions, links to access data and instrument User Guides and supplementary information to analyze the data (link to Instrument PDS Help Pages). These instruments typically operated in a 'survey mode' throughout the mission, taking data continuously while other science instruments determined the primary pointing of the spacecraft. These instruments were mounted to the spacecraft, some with limited ability to articulate. Although the science data is largely continuous, the spacecraft orientation often was not optimal for science observations. The instrument characteristics and fields-of-view are provided on the on the
instrument help pages.
CAPS — The Cassini Plasma Spectrometer made comprehensive three-dimensional mass-resolved plasma measurements in Saturn's magnetosphere. It consisted of three sensors that together measure the velocity distributions of electrons and ions from approximately 1 eV to several tens of keV, the Electron Spectrometer (ELS), the Ion Beam Spectrometer (IBS), and the Ion Mass Spectrometer (IMS).
MAG — The Cassini magnetometer was designed to characterize Saturn's internal planetary magnetic field and the global magnetospheric field. It consisted of two separate sensors on an 11-m boom, a fluxgate magnetometer at the mid-point of the boom and a helium magnetometer at the end of the boom.
RPWS — The Radio and Plasma Wave Science instrument was designed to study radio emissions, plasma waves, thermal plasma, lightning, and dust throughout the Saturnian system. Three nearly orthogonal electric field antennas are used to detect electric fields over a frequency range from 1 Hz to 16 MHz, and three orthogonal search coil magnetic antennas are used to detect magnetic fields over a frequency range from 1 Hz to 12 kHz. A Langmuir probe is used to measure the electron density and temperature.
INMS — The Ion and Neutral Mass Spectrometer was designed to the mass composition and number densities of neutral species and low-energy ions in key regions of the Saturn system. The primary scientific objectives were to characterize Titan's upper atmosphere and its interaction with Saturn's magnetosphere and to investigate the neutral and plasma environments of the rings and icy satellites and their magnetospheric interactions.
MIMI — The Magnetospheric Imaging Instrument measured energetic electrons, ions, and neutrals using three separate sensors: (LEMMS) the low-energy magnetospheric measurement system, (CHEMS) the charge-energy-mass spectrometer, and (INCA) the ion and neutral camera. Each sensor detected particles in the local environment of the spacecraft and INCA had the additional capability of creating images out of energetic neutral atoms (ENAs) that can reach the spacecraft from large distances. At Saturn, MIMI data characterized Saturn's ion and electron radiation belts, the space environments of the rings, inner satellites, and Titan, the magnetosphere, high latitude regions, and boundaries, and characterized dynamics in Saturn's magnetosphere.
CDA — The Cosmic Dust Analyzer was designed to characterize the dust environment at the Saturn system. CDA consisted of two separate sensors, the High Rate Detector (HRD) and the Dust Analyzer (DA). The HRD is designed to monitor high impact rates in dust-rich environments such as during the Saturn ring plane crossings. The DA measured the electrical charge, mass, impact velocity, and elemental composition of the impacting the dust grains. At Saturn CDA investigated the physical, chemical and dynamical properties of impacting dust particles, and their interactions with satellites, rings, and Saturn's magnetosphere. (link to CDA PDS Help Page)
Magnetosphere Data
Internal Magnetic Field Models
Several internal magnetic field models have been developed over the course of the Cassini mission. They differ in the amount of data incorporated into the model and they differ in the methodology used, most notably in how the external magnetic field was modeled. The major references are listed here.
The internal magnetic field model summary table lists the magnetic field spherical harmonic coefficients. Consult each reference for information about the methods used to derive the model and uncertainties in the model coefficients.
- Internal Magnetic Field Model Summary Table
- Dougherty, M. K., Achilleos, N., Andre, N., Arridge, C. S., Balogh, A., Bertucci, C., Burton, M.E., Cowley, S.W.H., Erdos, G., Giampieri, G., Glassmeier, K. H., Khurana, K.K., Leisner, J., Neubauer, F.M., Russell, C.T., Smith, E.J., Southwood, DJ., and Tsurutani, B.T., (2005). Cassini magnetometer observations during Saturn orbit insertion. Science, 307(5713), 1266-1270.
- Burton, M. E., Dougherty, M. K., & Russell, C. T. (2009). Model of Saturn's internal planetary magnetic field based on Cassini observations. Planetary and Space Science, 57(14-15), 1706-1713.
- Burton, M. E., Dougherty, M. K., & Russell, C. T. (2010). Saturn's internal planetary magnetic field. Geophysical Research Letters, 37(24).
- Cao, H., Russell, C. T., Christensen, U. R., Dougherty, M. K., & Burton, M. E. (2011). Saturn's very axisymmetric magnetic field: No detectable secular variation or tilt. Earth and Planetary Science Letters, 304(1-2), 22-28.
- Cao, H., Russell, C. T., Wicht, J., Christensen, U. R., & Dougherty, M. K. (2012). Saturn's high degree magnetic moments: Evidence for a unique planetary dynamo. Icarus, 221(1), 388-394.
- Dougherty, M. K., Cao, H., Khurana, K.K., Hunt, G.J., Provan, G., Kellock, S., Burton, M.E., Burk, T.A., Bunce, E.J., Cowley, S.W.H, Kivelson, M.G., Russell, C.T & Southwood, D.J. Science, 2018, Vol 362 no. 6410 doi: 10.1126/science.aat5434.
Magnetospheric Reference Models
Several magnetospheric reference models have been, or are being developed.
FORTRAN source code for a
Tsyganenko-type model develop by Krishan Khurana is archived here. This model incorporated Cassini magnetic
field Cassini up to the year 2012.
Contact: Krishan kkhurana@igpp.ucla.edu
Another empirical model following the approach used to derive the Tsyganenko Terrestrial magnetic field
models is being developed by Grant Stephens and colleagues at APL.
Contacts: Grant Stephens, grant.stephens@jhuapl.edu
Don Mitchell, Donald.G.Mitchell@jhuapl.edu
Geometry and Event Information
Tour Atlas
The
Cassini Tour Atlas (
Readme File) provides geometric parameters for the entire mission. The Tour Atlas provides various geometric parameters (range, latitude, longitude, etc.) referenced to Saturn, Titan and the icy satellites in 5-minute and 1-hour time steps.

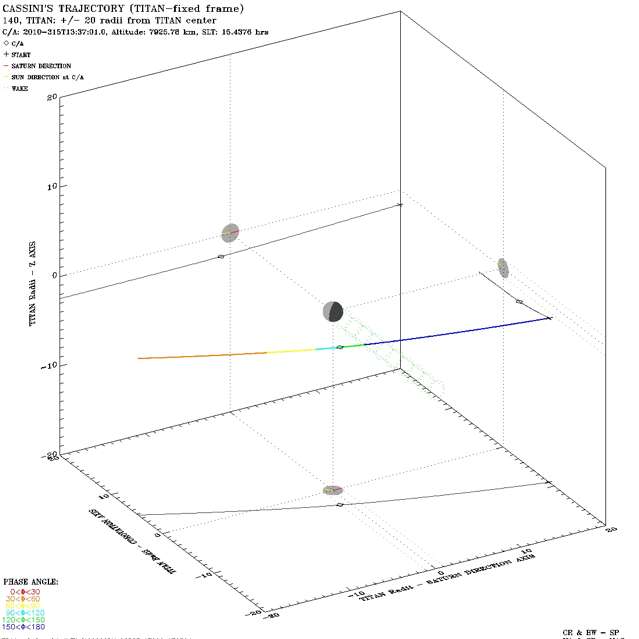
Several products are of particular interest to magnetospheric scientists. Three-dimensional geometry plots for Titan and icy satellite flybys are provided. The plots depict the spacecraft trajectory in a body-fixed reference frame (X from the satellite to Saturn, Y in the corotation direction). They show the Sun direction at closest approach, the solar phase angle throughout the flyby and depict the satellite wake.

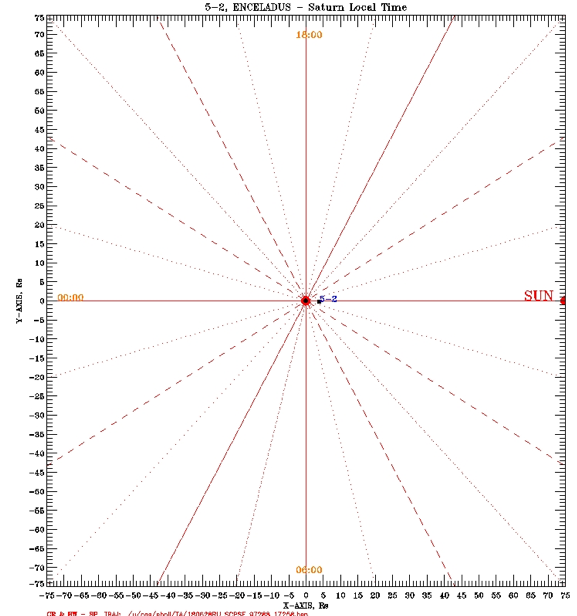
The Tour Atlas provides plots of the local time sector during each Titan and icy satellite flyby. The following plots shows the Enceladus flyby on orbit 5 near local noon.
Mission Events
A complete list of mission events related to magnetospheric studies is available in
PDF or in
XLSX format.
Saturn Geometry and Events
Icy and Rock Satellite Geometry
WebGeocalc
The
WebGeocalc Tool provides a web-based graphical user interface to many of the observation
geometry computations available from the
SPICE system. Users can perform SPICE computations without the need to write a program; the
user need have only a computer with a standard web browser. A
WebGeocalc Tutorial provides an introduction to this tool.
NAIF/SPICE Software
For SPICE calculations that cannot be done in WebGeocalc, users can program their own calculations in
SPICE.
link to final kernel and metakernel
Events
Preliminary Fields and Particles and Auroral Schedules to help find data at the planned observation dates t0 the top on Data Search Tools
The
Event Calendar helps to search for discrete events such as icy satellite and Titan flybys, periapses, apoapses, etc. The tool also allows one to search on several types of magnetospheric events identified by science data analysis and provided by the magnetospheric science community. The Searchable Calendar can be used to find the timing of certain observations that were executed on Cassini, such as remote sensing aurora observations.
Higher Order Products
Coordinate System Information
- Coordinate System description [DOCX]
- Although Saturn's magnetic field is very nearly axisymmetric, rotational modulation of nearly all magnetospheric phenomena (radio emissions, magnetic field perturbations, charged particles, energetic neutrals, motions of the plasma sheet, auroral oval, and magnetopause) have been observed.
Observations have shown that the periods associated with the northern hemisphere and the southern hemispheres have closely spaced but distinct periods and that these periods vary slowly by up to ~ ±1% about ~10.7 hr over Saturn's seasons. Various longitude systems based on magnetic field measurements and Saturn kilometric radio emission (SKR) measured by RPWS have been developed over the mission.
The phase model [TXT] for the magnetic perturbation systems and a User's Guide [PDF] has been provided by Gabby Provan.
Contact: Gabby Provan: gp31@leicester.ac.uk
A number of longitude systems defined by SKR emission measured by the RPWS instrument have been derived over the course of the mission (SLS2,3,4). The most recent is SLS5 developed by Ye et al., 2018. That reference provides a succinct history of the development of different SKR longitude systems over the course of the Cassini mission. Lamy (2011) also defined phase systems for both hemispheres (2004–2010) based on the variable periods of the northern and southern SKR, the power of which was separated according to circular polarization. More recently, Lamy (2017) extended the analysis to the end of the Cassini mission.
Coordinate System References
- Andrews, D. J., Bunce, E. J., Cowley, S. W. H., Dougherty, M. K., Provan, G., & Southwood, D. J. (2008). Planetary period oscillations in Saturn's magnetosphere: Phase relation of equatorial magnetic field oscillations and SKR modulation. Journal of Geophysical Research, 113, A09205.
- Lamy, L. (2011). Variability of Southern and Northern Saturn Kilometric Radiation Periodicities. In Planetary Radio Emissions VII (pp. 39–50). Vienna, Austria: Austrian Academy of Sciences Press.
- Lamy, L. (2017). The Saturnian Kilometric Radiation before the Cassini Grand Finale. In G. Fischer, G. Mann, M. Panchenko, & P. Zarka (Eds.), Planetary radio emissions VIII (pp. 171–190). Vienna: Austrian Academy of Sciences Press.
- Provan, G., Cowley, S. W. H., Bradley, T. J., Bunce, E. J., Hunt, G. J., & Dougherty, M. K. (2018). Planetary period oscillations in Saturn's magnetosphere: Cassini magnetic field observations over the northern summer solstice interval. Journal of Geophysical Research: Space
Physics, 123.
- Ye, S. Y., Fischer, G., Kurth, W. S., Menietti, J. D., & Gurnett, D. A. (2018). An SLS5 longitude system based on the rotational modulation of Saturn radio emissions. Geophysical Research Letters, 45(15), 7297-7305.
Reference Tables to Help Find Data
The tables below cross-reference time and date stamps to events important to the analysis of field and particle data. This
data is also available in the
Event Calendar.
Magnetosphere Crossing Time Tables
- This list of magnetopause and bow shock crossings list contains extra line breaks covers the entire Cassini mission and was compiled by C.M. Jackman, H. Brown and L. Tunstall at the University of Southampton.
It includes some crossings from earlier lists by H.J. McAndrews, S.J. Kanani, A. Masters, and J.C. Cutler (http://mapsview.engin.umich.edu/BSMP/index.php), as well as further crossings from N.M. Pilkington (Pilkington, N. M. et al. (2015),
Internally driven large-scale changes in the size of Saturn's magnetosphere, J. Geophys. Res. Space Physics, 120, 7289–7306, doi:10.1002/2015JA021290.).
Contact Point: Caitriona M Jackman: c.jackman@soton.ac.uk
- Magnetotail reconnection events were identified as transient structures related to tail reconnection (from strong deflections of the
north-south magnetic field component). DeltaBtheta is the size of the field deflection in nT, and the sign of the deflection is interpreted to provide
the direction of travel of the structure (negative = planetward moving and vice versa). Spacecraft location information is given in KSM coordinates
(units of Saturn radii) and in spherical polar coordinates: in units of Saturn radii, decimal hours and degrees. The 'Class' of the detection is either
'PlasmaSheet' or 'Lobe'. These are determined from the magnetic field characteristics around the detection. Detections classed as 'PlasmaSheet'
are either plasmoids or dipolarizations, while those classed as 'Lobe' are TCRs.
Points of contact: Andy Smith as33g10@soton.ac.uk, Caitriona Jackman, C.Jackman@soton.ac.uk
- This list of interchange injections in Saturn's inner and middle magnetosphere was identified
and published in Azari et al., Interchange Injections at Saturn: Statistical Survey of Energetic H+ Sudden Flux
Intensifications, in the Journal of Geophysical Research: Space Physics, 2018 (https://doi.org/10.1029/2018JA025391).
The point of contact for this event list is Abi Anzari, University of Michigan, azari@umich.edu.
- 'Young' injection events based on methodology of Kennelly et al., (2013) and updated by Hospodarsky in 2018:
Kennelly, T. J., Leisner, J. S., Hospodarsky, G. B., & Gurnett, D. A. (2013). Ordering of injection events within Saturnian SLS longitude and local time. Journal of Geophysical Research: Space Physics, 118(2), 832-838.
Point of Contact: George Hospodarsky, george-hospodarsky@uiowa.edu
- Diagrams showing
average positions of magnetopause crossings are available at the Univ. of MD Space
Physics site.
-
Apoapse Table contains epoch, period, orbital inclination, and range (
XLSX,
TXT)
Orbit Plots and Time Tables
Auroral Observations
Software to Help Find Data
needs formatting
  A number of useful tools and websites for magnetospheric science were developed throughout
  the mission by Cassini science team members and collaborators in the United States and Europe.
  These tools will be maintained only on a best-efforts basis. A brief description of the capability,
  URL and point of contact is given.

  JCSN is a science planning and visualization tool developed by the MIMI team.
  It can be used to display Cassini spacecraft attitude relative to various bodies in the
  Saturnian system.  It is also useful for displaying the MIMI instrument sensor fields and other
  fields and particles instrument fields of view.
  Contact: Don Mitchell, Donald.G.Mitchell@jhuapl.edu

  RPWS Cassini Trajectory plotting tool, developed by the RPWS team is a simple
  web-based tool that allows the user to plot the Cassini trajectory over a user-specified time
  period or set of orbits. Three coordinate systems are available Saturn Equatorial, Saturn Ecliptic
  and KSM.
  Contact: Bill Kurth, william-kurth@uiowa.edu

  MAPSVIEW is a website developed to facilitate collaboration between the magnetospheric
  science instrument teams during the mission. It was developed by the Cassini Magnetospheric
  Science Interdisciplinary scientist and colleagues at the University of Michigan.
  Contact: Tamas Gombosi, tamas@umich.edu

  AMDA - Automated Multi-Dataset Analysis is a web-based tool for on line analysis of space
  physics data (magnetospheric, heliospheric, planetary plasmas. Cassini magnetospheric data
  can be accessed here. The website has search and data visualization capability.
  Contact: Baptiste Cecconi, baptiste.cecconi@obspm.fr

  VESPA - The Virtual European Solar and Planetary Access website provides an interface to
  planetary data and models. The website has a search and data visualization capability.
  Contact: Baptiste Cecconi, baptiste.cecconi@obspm.fr

  APIS - The Auroral Planetary Imaging and Spectroscopy provides online access to processed
  auroral observations of the outer planets and their satellites. APIS consists of a database of planetary auroral observations acquired by the Hubble Space Telescope (HST) since 1997, a search interface and plotting tools. [Lamy, et al., 2015. The auroral planetary imaging and spectroscopy (APIS) service. Astronomy and Computing, 11, pp.138-145.]
  Contact: Laurent Lamy, laurent.lamy@obspm.fr

  Center for Space Physics, Planetary Atmospheres and Space Science Group at Boston University
  This website contains information and data on Saturn auroral UV imaging and spectroscopy.
  observations made by HST.
  Contact: John Clarke, jclarke@bu.edu
Analyzing Data
Plotting Software

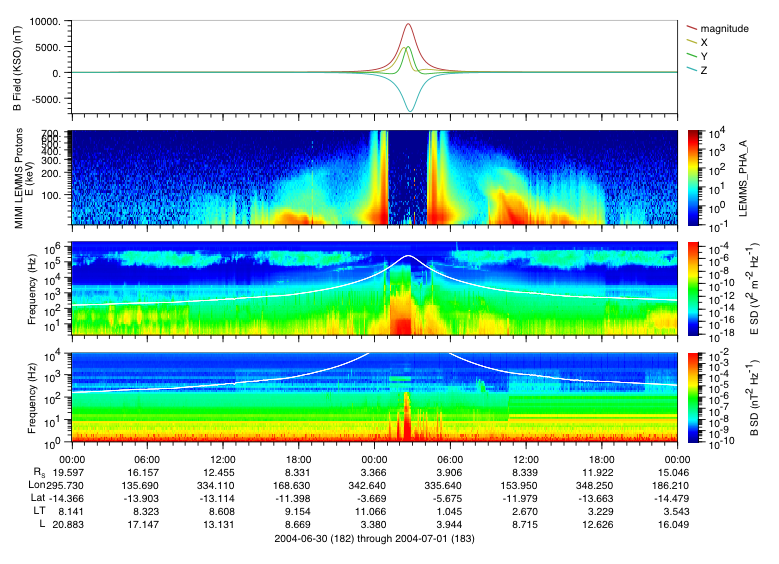
The Cassini Project supported development of science data plotting software by the RPWS team at the University of Iowa and the MIMI team at the Applied Physics Laboratory. The software builds on the capability developed by those teams during the Cassini mission. It provides the capability of plotting several magnetospheric science data sets and the spacecraft ephemeris as a stack plot on the same timescales. The underlying software is Autoplot, an interactive browser for viewing data and the Heliophysics Application Programmer's Interface (HAPI), widely used to access Heliophysics data. Further software development will occur during 2019.
The software may be found at
NASA's Planetary Science Github repository.
Points of contact (in order of who to contact first):
Bill Kurth: william-kurth@uiowa.edu
Don Mitchell: Donald.G.Mitchell@jhuapl.edu
Jon Vandegriff: Jon.Vandegriff@jhuapl.edu
Jeremy Faden: jeremy-faden@uiowa.edu
Chris Piker: chris-piker@uiowa.edu
Analysis Support Information
- The Spacecraft Events and Configuration Information page includes information to help interpret data. A variety of spacecraft events may introduce noise or artifacts into the data.
The following info found on that page may be relevant to the analysis of fields and particles data:
MAG SCAS intervals
MIMI INCA discharges
Main Engine Cover Closings
Thruster Firings
Probe Deployment Activities
Bus Imbalance Changes
Solid State Power Switch Trips
SOI Activities
Cassini Mass History
 PDS: The Planetary Atmospheres Node

 Several products are of particular interest to magnetospheric scientists. Three-dimensional geometry plots for Titan and icy satellite flybys are provided. The plots depict the spacecraft trajectory in a body-fixed reference frame (X from the satellite to Saturn, Y in the corotation direction). They show the Sun direction at closest approach, the solar phase angle throughout the flyby and depict the satellite wake.
 The Tour Atlas provides plots of the local time sector during each Titan and icy satellite flyby. The following plots shows the Enceladus flyby on orbit 5 near local noon.
 The Cassini Project supported development of science data plotting software by the RPWS team at the University of Iowa and the MIMI team at the Applied Physics Laboratory. The software builds on the capability developed by those teams during the Cassini mission. It provides the capability of plotting several magnetospheric science data sets and the spacecraft ephemeris as a stack plot on the same timescales. The underlying software is Autoplot, an interactive browser for viewing data and the Heliophysics Application Programmer's Interface (HAPI), widely used to access Heliophysics data. Further software development will occur during 2019.
The software may be found at NASA's Planetary Science Github repository.