
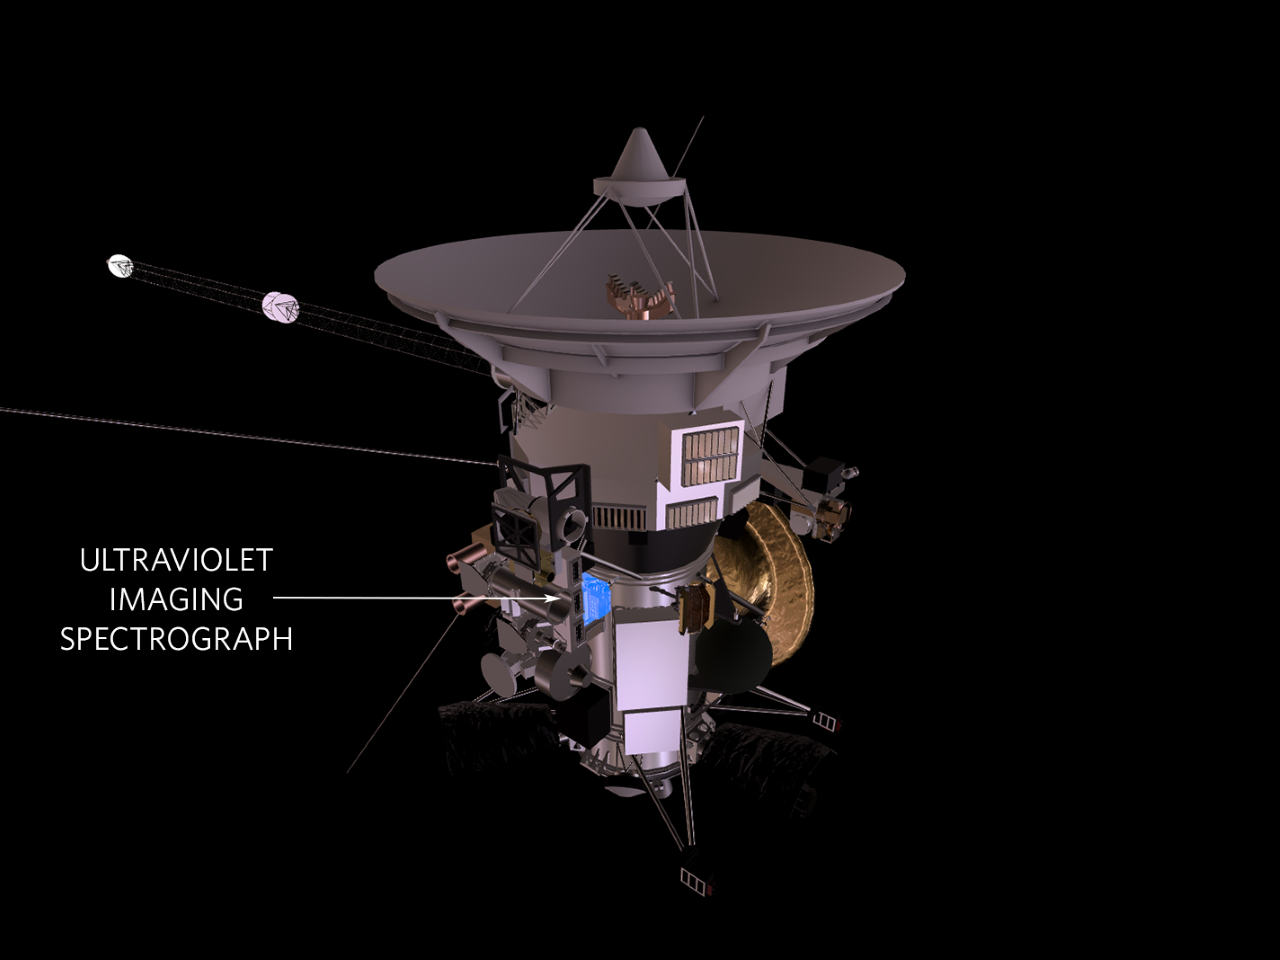
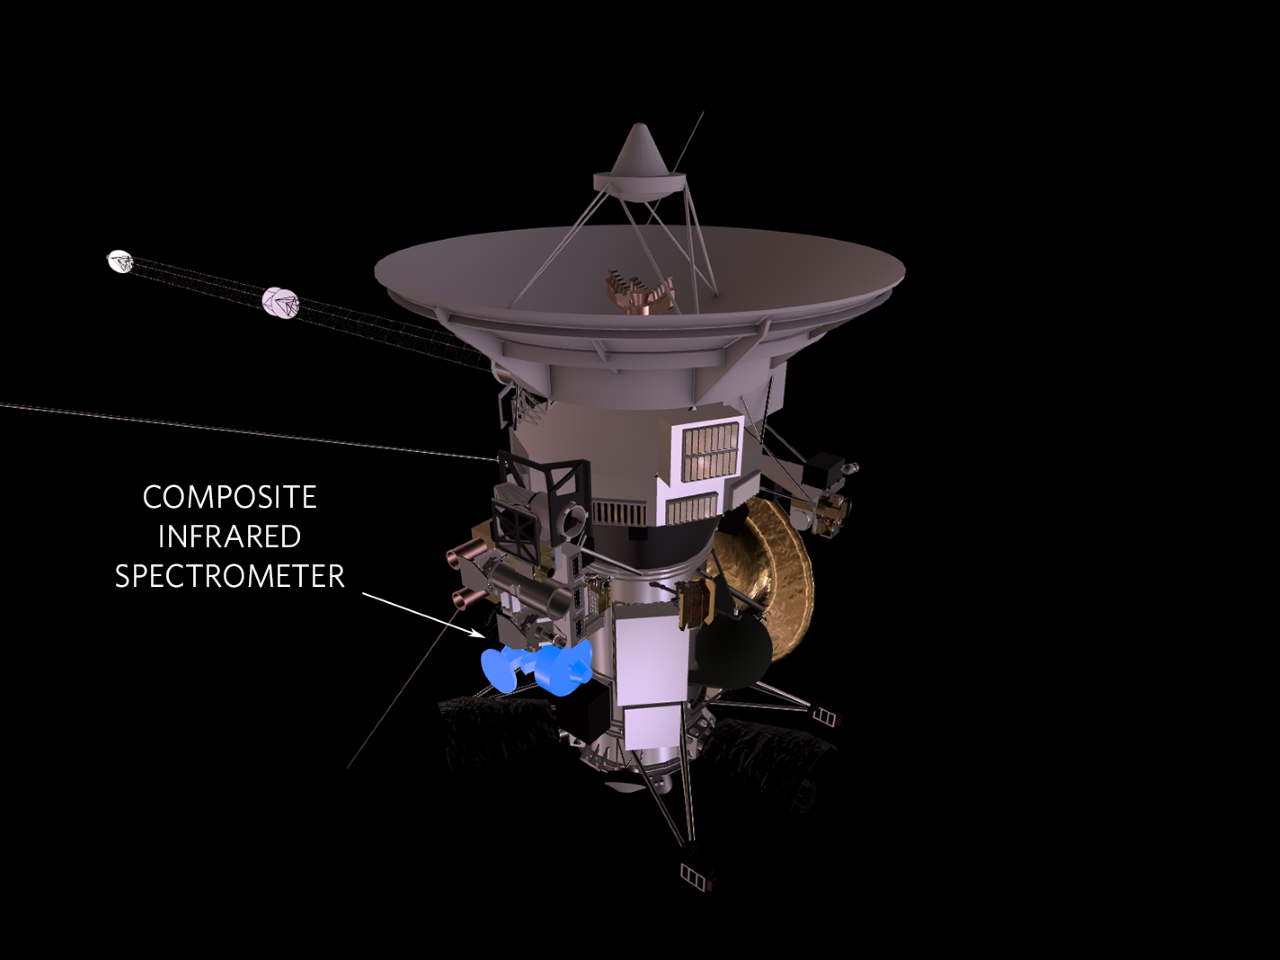
Location of the Cassini UV and IR Spectrographs
Introduction
These data were derived by combining measurements from stellar occultations observed by the extreme ultraviolet component (EUV) of the Cassini Ultraviolet Imaging Spectrograph (UVIS) and limb scans observed by the Composite Infrared Spectrometer (CIRS) to create empirical atmospheric structure models for Saturn corresponding to the locations probed by the occultations. Temperature-pressure (T-P) profiles retrieved from the CIRS limb scans in the stratosphere were combined with T-P profiles in the thermosphere retrieved from the UVIS occultations. Altitudes corresponding to the pressure levels in each case were derived based on a best fit composition model that included H2, He, CH4 and upper limits on H.
References
Esposito, L.W. et al., 2004., The Cassini Ultraviolet Imaging Spectrograph Investigation. Space Science Reviews, Volume 115, Issue 1-4, pp. 299-361. DOI 10.1007/s11214-004-1455-8
Koskinen T.T., Sandel B.R., Yelle R.V., Strobel D.F., Muller-Wodarg I.C.F, Erwin J.T., 2015., Saturn's variable thermosphere from Cassini/UVIS occultations. Icarus 260, 174-189, DOI 10.1016/j.icarus.2015.07.008.
Koskinen T.T., Moses J.I., West R.A., Guerlet S., Jouchoux A., 2015., The detection of benzene in Saturn's upper atmosphere. GRL 43 7895-7901, DOI 10.1002/2016GL070000.
Koskinen T.T., Guerlet S., 2018. Atmospheric structure and helium abundance on Saturn from Cassini/UVIS and CIRS observations., Icarus 307 161-171, DOI 10.1016/j.icarus.2018.02.020.
Description of the Data
These files contain H2 densities and temperatures retrieved from stellar occultations observed by the Cassini/UVIS, using the EUV channel, as well as Cassini/CIRS. Details of the instrument are described by Esposito et al. (2004) and the UVIS User Guideavailable through the Planetary Data System Rings node. The analysis of the EUV stellar occultation data on Saturn is described in detail by Koskinen et al. (2015) and the Appendix to the final report of the Saturn Atmosphere Modeling Group (SAMWG).
Each occultation event is stored as PDS4 XML label and data files. The following table depicts the individual occultation events.
Documentation
Accessing the data
The dataset
Each data file is specified by a unique identifier (URN). An index (CSV) is provided to aid in product selection. Some values in the table may not be consistent.
Citing the data
These data were derived by combining measurements from stellar occultations observed by the extreme ultraviolet component (EUV) of the Cassini Ultraviolet Imaging Spectrograph (UVIS) and limb scans observed by the Composite Infrared Spectrometer (CIRS) to create empirical atmospheric structure models for Saturn corresponding to the locations probed by the occultations. Temperature-pressure (T-P) profiles retrieved from the CIRS limb scans in the stratosphere were combined with T-P profiles in the thermosphere retrieved from the UVIS occultations. Altitudes corresponding to the pressure levels in each case were derived based on a best fit composition model that included H2, He, CH4 and upper limits on H.
References
Esposito, L.W. et al., 2004., The Cassini Ultraviolet Imaging Spectrograph Investigation. Space Science Reviews, Volume 115, Issue 1-4, pp. 299-361. DOI 10.1007/s11214-004-1455-8
Koskinen T.T., Sandel B.R., Yelle R.V., Strobel D.F., Muller-Wodarg I.C.F, Erwin J.T., 2015., Saturn's variable thermosphere from Cassini/UVIS occultations. Icarus 260, 174-189, DOI 10.1016/j.icarus.2015.07.008.
Koskinen T.T., Moses J.I., West R.A., Guerlet S., Jouchoux A., 2015., The detection of benzene in Saturn's upper atmosphere. GRL 43 7895-7901, DOI 10.1002/2016GL070000.
Koskinen T.T., Guerlet S., 2018. Atmospheric structure and helium abundance on Saturn from Cassini/UVIS and CIRS observations., Icarus 307 161-171, DOI 10.1016/j.icarus.2018.02.020.
Description of the Data
These files contain H2 densities and temperatures retrieved from stellar occultations observed by the Cassini/UVIS, using the EUV channel, as well as Cassini/CIRS. Details of the instrument are described by Esposito et al. (2004) and the UVIS User Guide
Each occultation event is stored as PDS4 XML label and data files. The following table depicts the individual occultation events.
| Altitude (Km) | Radius (Km) | Planetocentric Latitude (deg) | Planetocentric Longitude (Deg) | Number Density 1/m**3 | Number Density Error | Temperature (K) | Temperature Error | FM Number Density 1/m**3 | FM Temperature (K) | ||||||||||||||||||||
| 963.82 | 60455.16 | 18.96 | 154.77 | 8.12E+17 | 5.06E+16 | 205.62 | 10.91 | 8.71E+17 | 194.08 | ||||||||||||||||||||
| 1013.6 | 60506.31 | 18.94 | 154.72 | 4.97E+17 | 2.31E+16 | 197.81 | 7.25 | 4.64E+17 | 211.88 | ||||||||||||||||||||
| 1063.42 | 60557.45 | 18.93 | 154.67 | 2.70E+17 | 1.31E+16 | 217.08 | 6.16 | 2.60E+17 | 230.98 | ||||||||||||||||||||
| 1113.29 | 60608.61 | 18.91 | 154.63 | 1.46E+17 | 7.98E+15 | 250.48 | 7.96 | 1.52E+17 | 250.91 | ||||||||||||||||||||
| 1163.2 | 60659.76 | 18.9 | 154.58 | 8.81E+16 | 5.37E+15 | 278.7 | 9.87 | 9.24E+16 | 271.09 | ||||||||||||||||||||
| 1213.15 | 60710.92 | 18.88 | 154.54 | 5.77E+16 | 3.59E+15 | 297.47 | 12.29 | 5.84E+16 | 290.88 | ||||||||||||||||||||
| 1262.98 | 60762.09 | 18.87 | 154.49 | 3.78E+16 | 2.51E+15 | 314.31 | 13.79 | 3.82E+16 | 309.68 | ||||||||||||||||||||
| 1312.85 | 60813.26 | 18.85 | 154.45 | 2.57E+16 | 1.81E+15 | 336.91 | 15.77 | 2.57E+16 | 327.08 | ||||||||||||||||||||
| 1362.76 | 60864.43 | 18.84 | 154.4 | 1.75E+16 | 1.50E+15 | 355.03 | 18.94 | 1.78E+16 | 342.77 | ||||||||||||||||||||
| 1412.56 | 60915.6 | 18.82 | 154.35 | 1.27E+16 | 1.20E+15 | 374.02 | 22.76 | 1.25E+16 | 356.53 | ||||||||||||||||||||
| 1462.54 | 60966.78 | 18.81 | 154.31 | 9.03E+15 | 9.64E+14 | 384.37 | 27.61 | 9.01E+15 | 368.44 | ||||||||||||||||||||
| 1512.41 | 61017.96 | 18.79 | 154.26 | 6.88E+15 | 8.24E+14 | 396.24 | 30.12 | 6.58E+15 | 378.48 | ||||||||||||||||||||
| 1562.31 | 61069.15 | 18.78 | 154.22 | 5.18E+15 | 6.50E+14 | 372.43 | 29.67 | 4.86E+15 | 386.85 | ||||||||||||||||||||
| 1612.24 | 61120.34 | 18.76 | 154.17 | 4.56E+15 | 5.48E+14 | 334.68 | 28.74 | 3.63E+15 | 393.73 | ||||||||||||||||||||
| 1662.21 | 61171.54 | 18.75 | 154.13 | 3.30E+15 | 4.70E+14 | 351.02 | 33.3 | 2.73E+15 | 399.34 | ||||||||||||||||||||
| 1712.06 | 61222.74 | 18.73 | 154.08 | 1.82E+15 | 3.75E+14 | 439.49 | 50.24 | 2.07E+15 | 403.85 | ||||||||||||||||||||
| 1762.09 | 61273.94 | 18.71 | 154.03 | 1.44E+15 | 3.33E+14 | 497.86 | 57 | 1.58E+15 | 407.48 | ||||||||||||||||||||
| 1812 | 61325.14 | 18.7 | 153.99 | 1.36E+15 | 3.18E+14 | 459.96 | 51.28 | 1.21E+15 | 410.36 | ||||||||||||||||||||
| 1861.94 | 61376.35 | 18.68 | 153.94 | 7.40E+14 | 2.49E+14 | 420.07 | 39.2 | 9.27E+14 | 412.64 | ||||||||||||||||||||
| 1911.92 | 61427.57 | 18.67 | 153.9 | 5.95E+14 | 2.30E+14 | 412.14 | 35.51 | 7.14E+14 | 414.45 | ||||||||||||||||||||
| 1961.92 | 61478.78 | 18.65 | 153.85 | 5.23E+14 | 2.02E+14 | 413.83 | 32.97 | 5.52E+14 | 415.88 | ||||||||||||||||||||
| 2011.79 | 61530 | 18.64 | 153.81 | 4.96E+14 | 1.82E+14 | 415.77 | 34.03 | 4.27E+14 | 416.99 | ||||||||||||||||||||
| 2061.85 | 61581.23 | 18.63 | 153.76 | 3.40E+14 | 1.49E+14 | 416.5 | 36.98 | 3.31E+14 | 417.87 | ||||||||||||||||||||
| 2111.78 | 61632.45 | 18.61 | 153.71 | 1.96E+14 | 9.05E+13 | 416.5 | 41.17 | 2.57E+14 | 418.56 | ||||||||||||||||||||
| 2161.9 | 61683.69 | 18.6 | 153.67 | 1.25E+14 | 5.31E+13 | 416.59 | 45.93 | 2.00E+14 | 419.1 | ||||||||||||||||||||
| 2211.88 | 61734.92 | 18.58 | 153.62 | 0.00E+00 | 0.00E+00 | 416.82 | 47.76 | 1.55E+14 | 419.52 | ||||||||||||||||||||
| 2261.89 | 61786.16 | 18.57 | 153.58 | 0.00E+00 | 0.00E+00 | 417.26 | 54.92 | 1.21E+14 | 419.85 | ||||||||||||||||||||
| 2311.92 | 61837.4 | 18.55 | 153.53 | 0.00E+00 | 0.00E+00 | 417.94 | 65.22 | 9.43E+13 | 420.11 | ||||||||||||||||||||
| 2361.82 | 61888.65 | 18.54 | 153.48 | 0.00E+00 | 0.00E+00 | 418.98 | 73.33 | 7.36E+13 | 420.31 | ||||||||||||||||||||
| 2411.91 | 61939.9 | 18.52 | 153.44 | 0.00E+00 | 0.00E+00 | 420.26 | 57.74 | 5.74E+13 | 420.47 | ||||||||||||||||||||
| 2462.01 | 61991.15 | 18.51 | 153.39 | 0.00E+00 | 0.00E+00 | 421.03 | 28.23 | 4.48E+13 | 420.59 | ||||||||||||||||||||
| 2511.98 | 62042.41 | 18.49 | 153.35 | 0.00E+00 | 0.00E+00 | 0 | 0 | 3.50E+13 | 420.69 | ||||||||||||||||||||
| 2561.97 | 62093.67 | 18.48 | 153.3 | 0.00E+00 | 0.00E+00 | 0 | 0 | 2.74E+13 | 420.76 | ||||||||||||||||||||
| 2612.14 | 62144.93 | 18.46 | 153.26 | 0.00E+00 | 0.00E+00 | 0 | 0 | 2.14E+13 | 420.82 | ||||||||||||||||||||
| 2662.18 | 62196.19 | 18.45 | 153.21 | 0.00E+00 | 0.00E+00 | 0 | 0 | 1.68E+13 | 420.87 | ||||||||||||||||||||
| 2712.23 | 62247.47 | 18.43 | 153.16 | 0.00E+00 | 0.00E+00 | 0 | 0 | 1.31E+13 | 420.9 | ||||||||||||||||||||
| 2762.3 | 62298.74 | 18.42 | 153.12 | 0.00E+00 | 0.00E+00 | 0 | 0 | 1.03E+13 | 420.93 | ||||||||||||||||||||
| 2812.39 | 62350.02 | 18.4 | 153.07 | 0.00E+00 | 0.00E+00 | 0 | 0 | 8.07E+12 | 420.95 | ||||||||||||||||||||
| 2862.49 | 62401.3 | 18.39 | 153.03 | 0.00E+00 | 0.00E+00 | 0 | 0 | 6.33E+12 | 420.97 | ||||||||||||||||||||
| 2912.62 | 62452.58 | 18.38 | 152.98 | 0.00E+00 | 0.00E+00 | 0 | 0 | 4.97E+12 | 420.98 | ||||||||||||||||||||
| 2962.59 | 62503.88 | 18.36 | 152.94 | 0.00E+00 | 0.00E+00 | 0 | 0 | 3.90E+12 | 420.99 |
Documentation
Accessing the data
The dataset
Each data file is specified by a unique identifier (URN). An index (CSV) is provided to aid in product selection. Some values in the table may not be consistent.
PDS recommendations for citing data sets can be found here.
Koskinen, et. al, (2019), Structure of Saturn's Thermosphere from Stellar Occultations Bundle, PDS Atmospheres (ATM) Node, https://doi.org/10.17189/518e-p721
Koskinen, et. al, (2019), Structure of Saturn's Thermosphere from Stellar Occultations Bundle, PDS Atmospheres (ATM) Node, https://doi.org/10.17189/518e-p721