

July 20, 1976 (Ls 96.8 MY 12) to Aug 18, 1979 (Ls 341.4 MY 13)
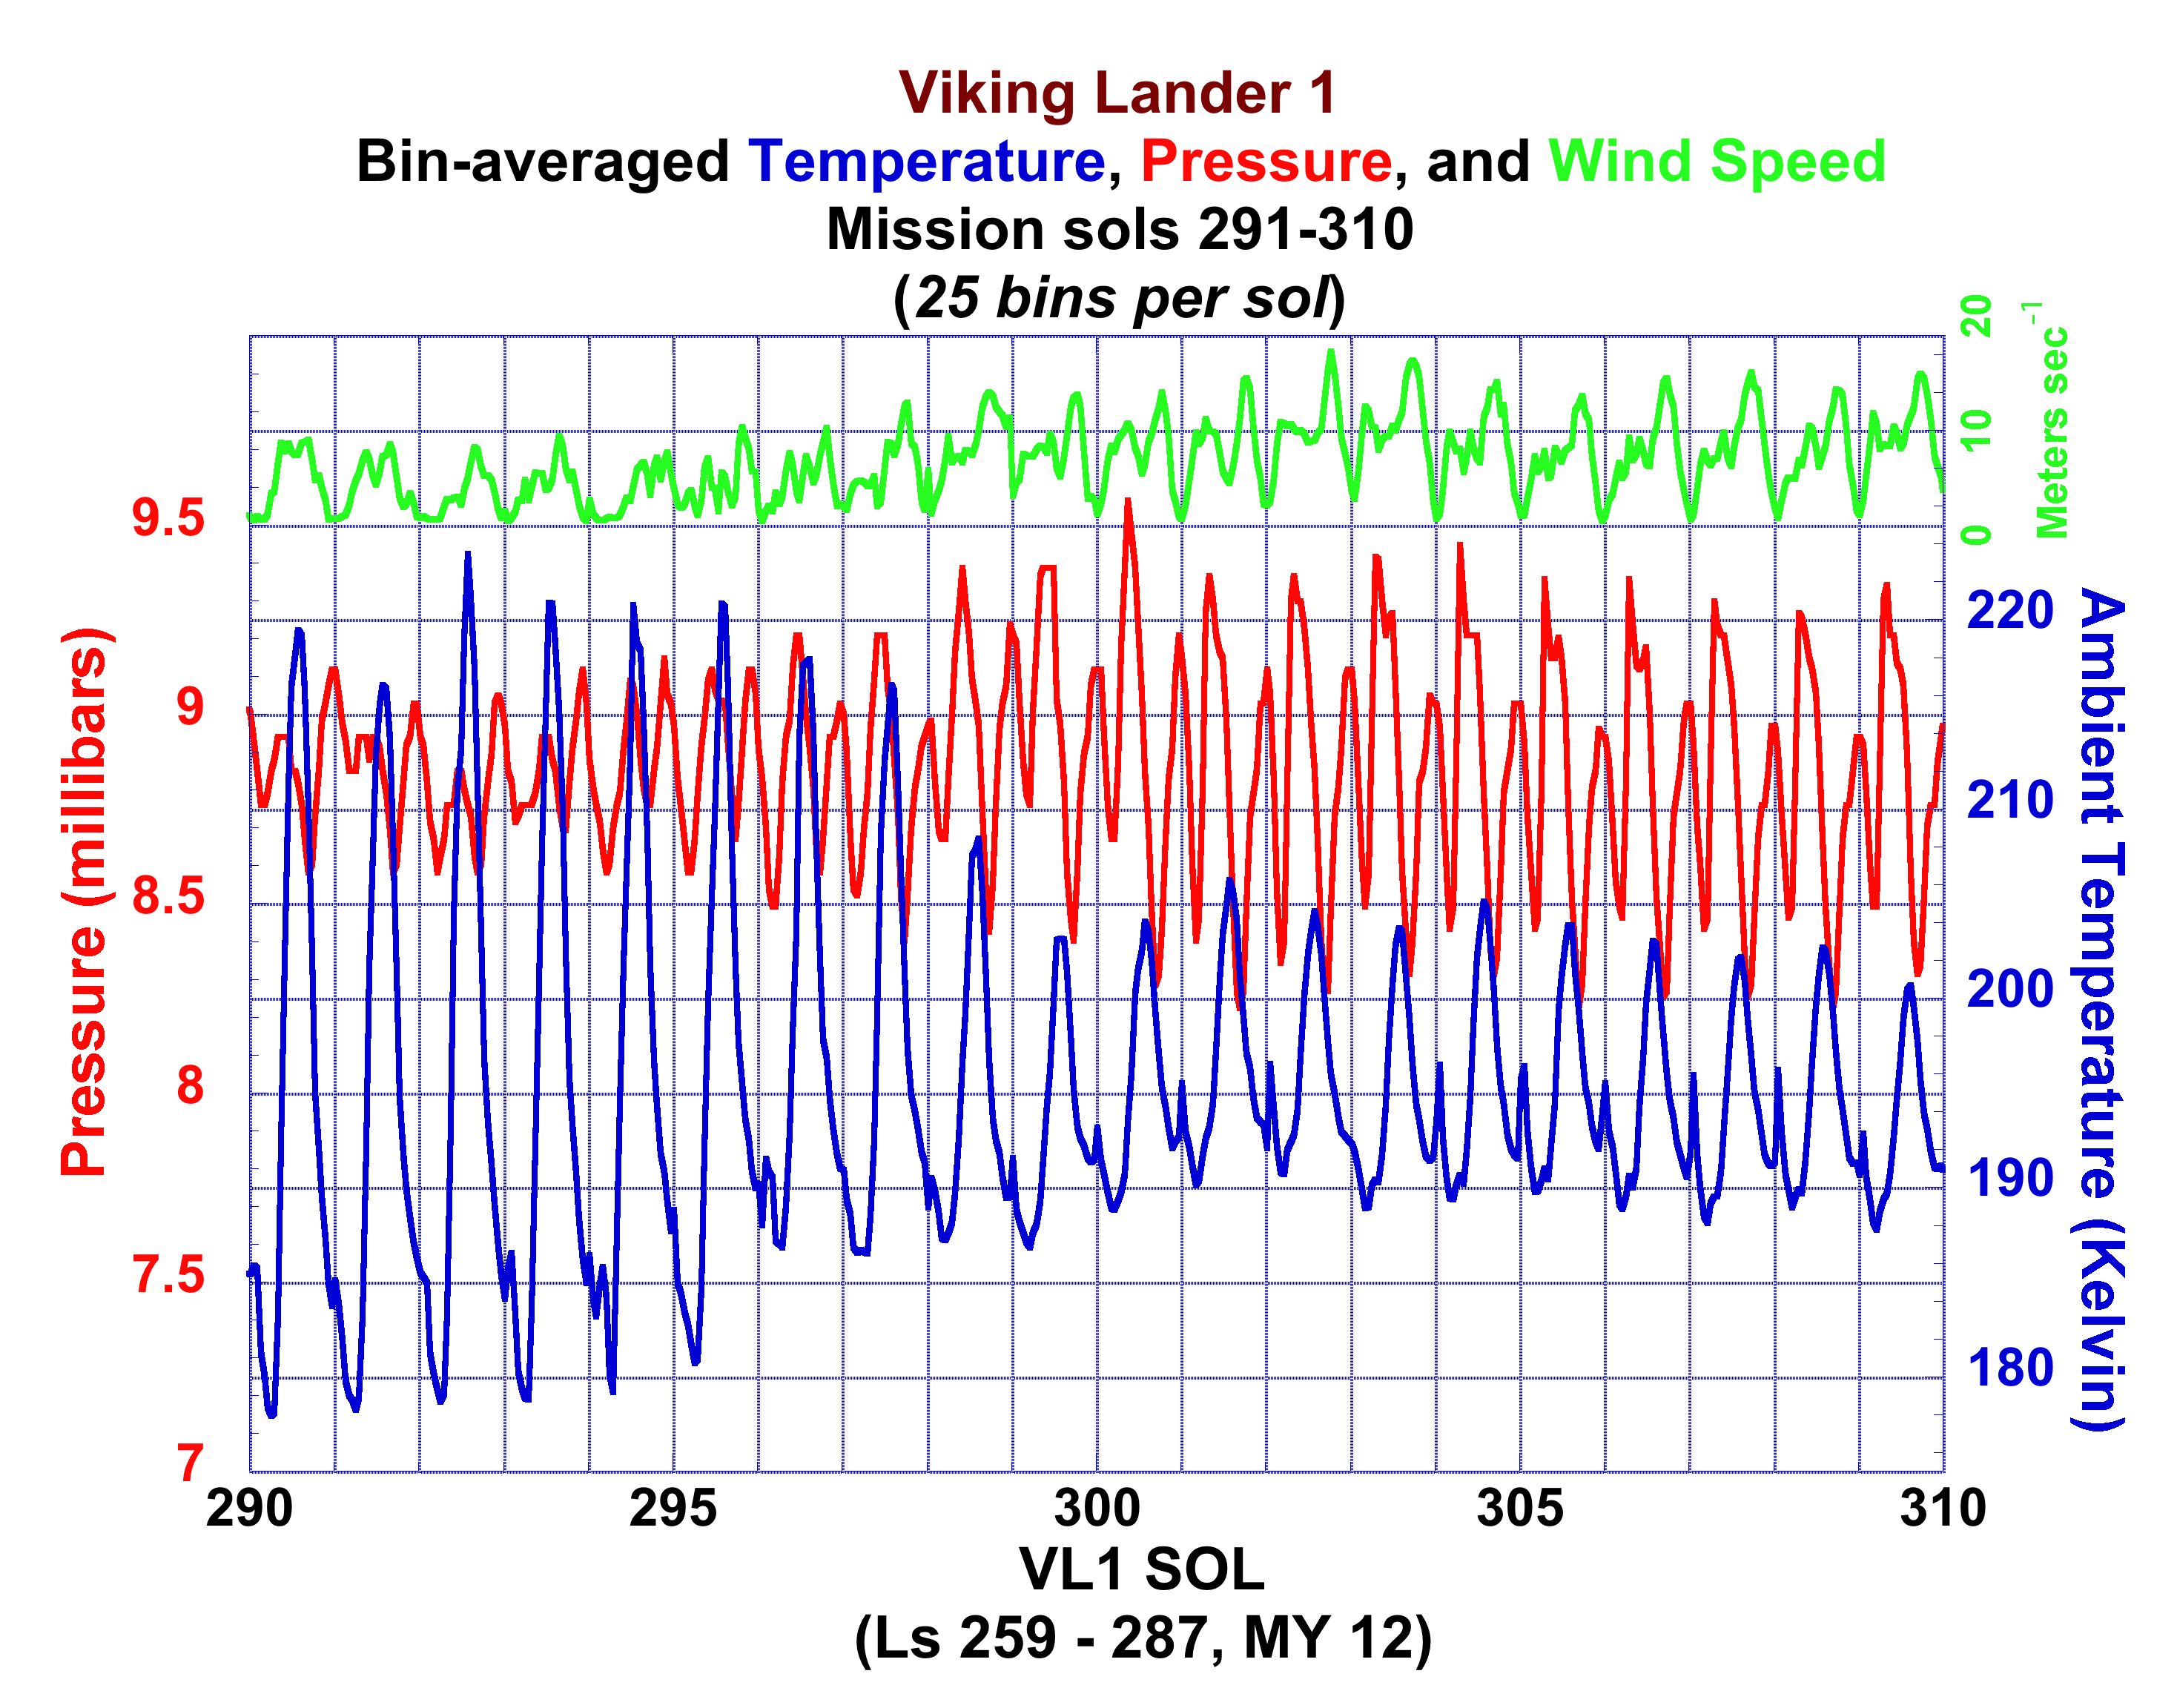
This plot shows data obtained during a 20-sol interval of the Viking Lander 1 mission during which the 1977b global dust storm developed. Each 'bin' spans 1/25th of a martian sol, and thus represents a bit less than one hour of data.

The Viking 1 Meteorology Boom, on which were located the wind speed and direction sensors and the Ambient and Reference temperature sensors
Useful Mission Documents
Data
The data descriptions for Viking Lander 1 Hourly-averaged Vl1 Surface meteorology data (pressure, temperature, wind speed and direction - sols 1-350) and Viking lander 1 & 2 Hourly-averaged Surface meteorology data (pressure, temperature, wind speed and direction - Viking Lander 2 mission sols 1-1050 and sols 1-40 of the Lander 1 mission) describe these dataset that contain binned and splined data obtained from the Viking Meteorology Instrument System (VMIS). The datasets consist of mean values of pressure, temperature, and wind speed (zonal, meridional and combined) and relevant statistics and warning flags calculated for 25 bins of equal duration per sol.
Retrieving the Data Volume
Within the data volume the Viking 1 data file and labels are identified as vl_mbin.dat, vl_mbin.xml and vl_mbin.lbl respectively while the data file and labels for the combined Viking 1 and 2 data are identified as vl_tbin.dat, vl_tbin.xml and vl_tbin.lbl respectively.
Citing Datasets for Publication
Murphy, J.R., VL1-M-MET-4-BINNED-P-T-V-CORR-V1.0, NASA Planetary Data System, 1989.
Tillman, J.E., VL1/VL2-M-MET-4-BINNED-P-T-V-V1.0, NASA Planetary Data System, 1989.
VL1/VL2-M-MET-4-BINNED-P-T-V-vl.0